Like
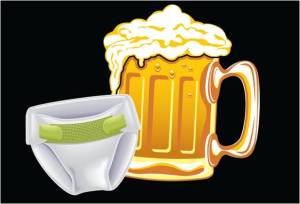
Beer and Nappies
There are many brilliant stories when BIG DATA comes. The most famous one would be the stories of “Beer and Nappies”
Someone may confuse what is the relationship between beer and nappies? Maybe little love drinking beers? Ha-ha %>_<%
Here is the story:
(Transpond from The myth of data mining)
Why men don’t buy beer and diapers at the same time, and what we can still learn from urban legends.
Wal-Mart, the world’s largest retailer, supposedly found out that there are certain times at which beer and diapers sell particularly well together – when on Friday evenings young men make a last dash to the supermarket to get beer and their wives call after them, “Pick up some diapers, too, honey!”
“Some of the ways Wal-Mart managers found to exploit their findings are legendary. One such legend is the story, “diapers and beer”. Wal-Mart discovered through data mining that the sales of diapers and beer were correlated on Friday nights. It determined that the correlation was based on working men who had been asked to pick up diapers on their way home from work. On Fridays the men figured they deserved a six-pack of beer for their trouble; hence the connection between beer and diapers. By moving these two items closer together, Wal-Mart reportedly saw the sales of both items increase geometrically.”
A version with a slightly different view of the roles involved suggests that the men are sent to the supermarket for the diapers and, because there’s no time left to go to a bar, take beer home with them.
In all versions of the story, Wal-Mart then puts the diapers closer to the beer and makes a fortune. (4)
It never happened like that, though, and the story should be filed under the category of Urban Legends. Nevertheless, the tale is a good one and we can learn something from it (”never let truth get in the way of a good story”). I myself have often been tempted to invent stories like this in order to express something in a way that everyone can understand. When we went hunting for treasure in the data at Gühring, Metabo or Sandoz uses the data mining system that we built in our university days, we discovered all kinds of the conspicuous features that we couldn’t understand because we didn’t have the background knowledge. We showed our results to the people at the companies named and they confirmed we had come up with valuable indicators. The business of making such results comprehensible to third-parties using concrete examples, however, always provide at least as complicated as the data treasure hunt itself.
What the diapers-and-beer example, should tell us is this: There are algorithms which we can use for automated recognition of data associations. If we find insights that make the competition go pale with fear off the bat, on the other hand, is another question entirely.
References
Reese Hedberg, S., The Data Gold Rush, Byte 20 (1995) 10, p. 83.
Just how widespread this legend is, is documented, among others, by Fisk, D., Beer and Nappies – A Data Mining Urban Legend, accessed on January 25, 2006.
Hospel, H., Down the Rabbit Hole, Executive Update Online No. 3/2001, accessed on January 25, 2006.
A persuasive version of how the legend arose can be found in Fawcett, T., Origin of “diapers and beer”, accessed on January 25, 2006.
Repost from web site: http://blog.bissantz.com/myth-of-data-mining
Big data is changing our world!!
Big data at work: 12 stories about reinvention
Big data have become something of a buzzword. Everybody talks about it, but its impact can be elusive. How is big data really changing the way companies and other organizations function? These 12 stories highlight that transformation: from helping health insurers keep better tabs on patients, on changing how cars are made, to easing traffic congestion on busy freeways. These case studies show big data at work.
Healthcare
We’ve got the medicine to treat lots of ailments — the challenge is getting doctors and patients to focus on the the one or two intervention programs that would make a real difference to a person’s health. Aetna is using big data to try to achieve that.
Cars
When most people think about how cars are built, they think about assembly lines and manufacturing robots. But at Ford, big data is impacting the parts and features of those cars before they’re ever part of a design file.
Presidential campaigns
Many people use Facebook to update their status, share photos, and “like” content. The Obama presidential campaign used all that data on the social network to not just find voters but to assemble an army of volunteers.
–From How Obama’s data scientists built a volunteer army on Facebook
Highway traffic
Anyone who has driven in Los Angeles has experienced the traffic nightmare. The goverment is using big data to keep traffic moving on the I-10 and I-110 freeways for drivers who are willing to pay for less congestion.
–From Hey, Los Angeles, Xerox thinks it can clear traffic on I-10
Pro basketball
Pro sports teams collect vast amounts of data, yet they’re struggling to make sense of it. Are there two or three things that will guarantee teams a win or at least tip the scale in their favor? That’s Krossover’s premise.
–From How to make your mark in professional basketball at 5′ 9″
Music
More than a decade ago, the music metadata company Gracenote received some cryptic advice from Apple to buy more servers. It did, Apple launched iTunes and the iPod, and Gracenote became a metadata empire.
–From Gracenote co-founder on ‘iPod day’ and better music through data
Social networking
Five years ago, LinkedIn was a shell of the technology company. Today, it’s an engineering powerhouse. Here’s how it got there.
–From How and why LinkedIn is becoming an engineering powerhouse
Insurance
The insurance industry hasn’t exactly been a beacon of technological innovation. But MetLife has bet $300 million on a new system that for the first time puts everything it knows about its customers in one place.
–From The promise of better data has MetLife investing $300M in new tech
Television
For sports fans, keeping up with what’s on TV is a near impossibility. On many nights there are hundreds of events spread across 8,000-plus channels. One app tracks all that sports and rates games based on how exciting the action is — so you know what to tune into.
Social change
One of India’s highest-rated TV shows aggregates and analyzes the millions of messages it receives from viewers on controversial issues like female feticide, caste discrimination and child abuse — and uses that data to push for political change.
–From How India’s favorite TV show uses data to change the world
Prescription drugs
While drug prices tend to dominate discussions about prescription drugs, we shouldn’t overlook the economic problems caused by abuse and misuse. One company is using sophisticated models to detect fraud and predict when people will stop taking medications on time.
–From Not taking your medication, or taking waaay too much? The data knows…
MailChimp’s core business is email — it sends about 35 billion emails a year on behalf of roughly 3 million users. But it’s what the company is doing with the data from all those emails that may represent its future.
–From How MailChimp learned to treat data like orange juice and rethink email in the process
repost, written by Drrick, Harris May23, 2013
retrieved on 2014/11/23, from website: https://gigaom.com/2013/05/23/big-data-at-work-12-stories-about-reinvention/
What is Big Data?
People are talking big data and data-driving decision frequently in recent years. So what is Big Data?
The definition from Wiki
Big data is an all-encompassing term for any collection of data sets so large and complex that it becomes difficult to process them using traditional data processing applications.
The challenges include analysis, capture, creation, search, sharing, storage, transfer, visualization, and privacy violations. The trend to larger data sets is due to the additional information derivable from analysis of a single large set of related data, as compared to separate smaller sets with the same total amount of data, allowing correlations to be found to “spot business trends, prevent diseases, combat crime and so on.”
The defined from SAS-The power of Know:
http://www.sas.com/en_us/insights/big-data/what-is-big-data.htmlBig data defined
As far back as 2001, industry analyst Doug Laney (currently with Gartner) articulated the now mainstream definition of big data as the three Vs of big data: volume, velocity and variety1.
- Volume. Many factors contribute to the increase in data volume. Transaction-based data stored through the years. Unstructured data streaming in from social media. Increasing amounts of sensor and machine-to-machine data being collected. In the past, excessive data volume was a storage issue. But with decreasing storage costs, other issues emerge, including how to determine relevance within large data volumes and how to use analytics to create value from relevant data.
- Velocity. Data is streaming in at unprecedented speed and must be dealt with in a timely manner. RFID tags, sensors and smart metering are driving the need to deal with torrents of data in near-real time. Reacting quickly enough to deal with data velocity is a challenge for most organizations.
- Variety. Data today comes in all types of formats. Structured, numeric data in traditional databases. Information created from line-of-business applications. Unstructured text documents, email, video, audio, stock ticker data and financial transactions. Managing, merging and governing different varieties of data is something many organizations still grapple with.
At SAS, we consider two additional dimensions when thinking about big data:
- Variability. In addition to the increasing velocities and varieties of data, data flows can be highly inconsistent with periodic peaks. Is something trending in social media? Daily, seasonal and event-triggered peak data loads can be challenging to manage. Even more so with unstructured data involved.
- Complexity. Today’s data comes from multiple sources. And it is still an undertaking to link, match, cleanse and transform data across systems. However, it is necessary to connect and correlate relationships, hierarchies and multiple data linkages or your data can quickly spiral out of control.
Source: META Group. “3D Data Management: Controlling Data Volume, Velocity, and Variety.” February 2001.


